ModTran is a tool, not a climate model.
Regarding climate models, one picture is worth a thousand words:
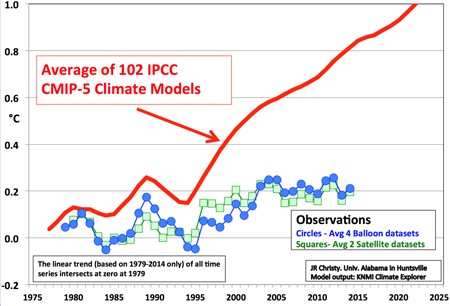
Green squares are Satellite data, measuring earth surface (lower troposphere) temperatures twice daily on a 1 degree latitude by 1 degree longitude grid (approx. 60,000 data points per scan, twice a day).
Blue dots are weather balloon data
“IPCC” is the UN sponsored International Panel on Climate Change. The IPCC models are the basis of alarm over carbon dioxide from fossil fuels. As can be seen, the IPCC models have projected average global temperatures far above actual observed.
The components of the red line above are drawn from the following predictions:

Predictions of Global Climate Models used by the IPCC
“Global Warming Predictions”. Licensed under CC BY-SA 3.0 via Wikimedia Commons – http://commons.wikimedia.org/wiki/File:Global_Warming_Predictions.png#/media/File:Global_Warming_Predictions.png